Why HTML?
A World Beyond Static PDFs and Powerpoints
One Quarto source renders to HTML, PDF, revealjs and PowerPoint. The same drought data, shown in each, makes the case for HTML as the default and marks out where PDF still wins.
HTML should be the default format for reports and slides. It carries everything a PDF or a PowerPoint deck carries, and adds what a fixed page cannot: figures a reader can hover and zoom, tables they can search and sort, and code they can fold away. PDF still does some jobs better, covered at the end. This post makes the case with one data set rendered four ways.
One Source, Four Formats
Quarto (.qmd) combines Markdown with code (R, Python, Julia and others). A single source file renders to either kind of output:
- Interactive (HTML and revealjs): readers explore data, filter regions, inspect values and fold code blocks.
- Static (PDF and PowerPoint): fixed pages for print, archives or offline slides.
| Target | Interactive Web | Static Canvas |
|---|---|---|
| Report | html |
pdf |
| Slides | revealjs |
pptx |
The example documents behind this post render from one source each:
Example Data
The data comes from the U.S. Drought Monitor. It contains 325,728 rows across 1044 weeks from July 2001 to July 2021. Each row records the share of a state’s land area at one drought severity level, from D0 (abnormally dry) to D4 (exceptional drought).
The U.S. Drought Monitor is produced by the National Drought Mitigation Center at the University of Nebraska–Lincoln, the USDA and NOAA. This snapshot was distributed by TidyTuesday on July 20, 2021.
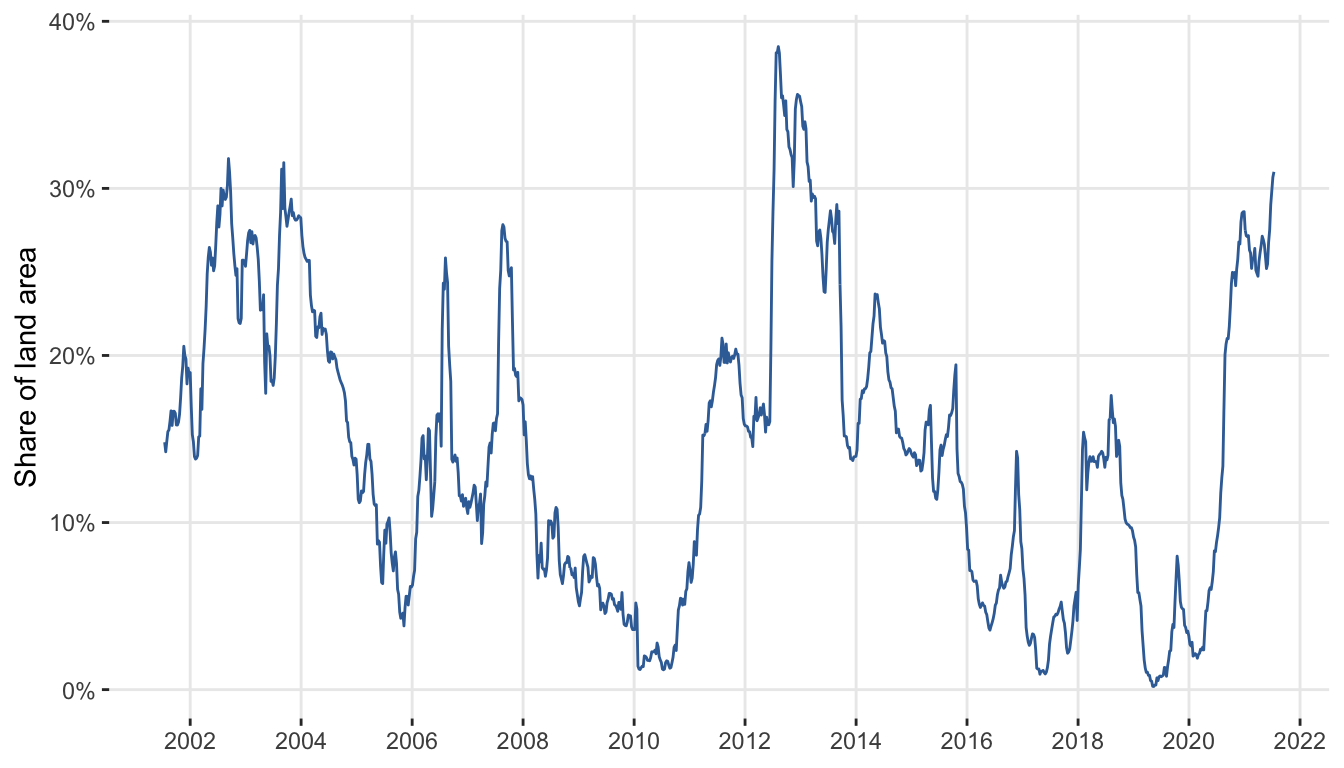
The measure used throughout is D2+, the share of state area in severe drought or worse (D2 to D4). The worst week on record was August 7, 2012, with 38.5% of national land area in D2+.
Exhibit Differences: HTML vs Static
Each exhibit below has an HTML version and the static version a PDF or slide deck would carry. The HTML version opens first; the static one is a tab away.
Maps: Animate and Hover
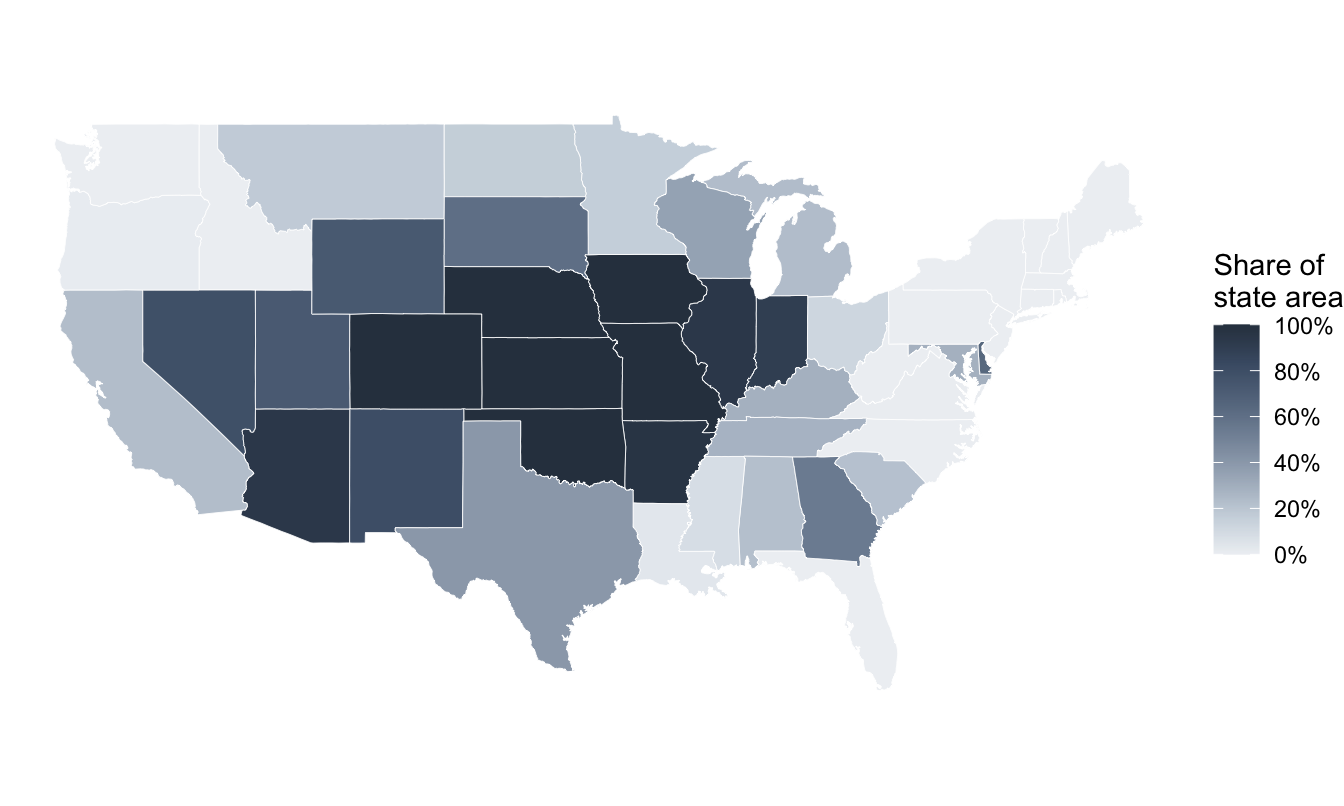
The HTML map (Figure 1) animates quarterly averages across two decades and shows each state’s value on hover, Alaska and Hawaii included. The static map (Figure 2) prints one week and omits Alaska, Hawaii and Puerto Rico, which its boundary file does not cover.
Time Series: Hover and Zoom
The HTML series (Figure 3) reads out any week on hover and zooms to any range with the slider. The static series (Figure 4) plots the whole record on fixed axes.
Tables: Search and Sort
The HTML table (Table 1) holds all 52 states and territories, sortable on any column and searchable by name. A static table has to truncate, spill across pages or slides, or summarize; Table 2 keeps the top ten.
| State | Average D2+ | Peak D2+ | Week of peak |
|---|---|---|---|
| NV | 37.6% | 100% | Jul 2007 |
| AZ | 37.1% | 100% | Jun 2002 |
| NM | 33.9% | 100% | Dec 2003 |
| UT | 30.9% | 100% | Sep 2002 |
| CA | 30.4% | 100% | May 2014 |
| WY | 29.2% | 100% | Sep 2002 |
| CO | 26.6% | 100% | Jul 2012 |
| OR | 22.7% | 100% | Jul 2015 |
| TX | 22.1% | 99% | Sep 2011 |
| ID | 21.4% | 100% | Jul 2001 |
Technical Trade-offs
| Capability | html |
pdf |
revealjs |
pptx |
|---|---|---|---|---|
| Interactive Figures | Yes | No | Yes | No |
| Code Folding | Yes | No | Yes | No |
| Tabsets | Yes | No | Yes | No |
| Searchable Tables | Yes | No | Yes | No |
| Canvas Type | Scroll | Fixed Pages | Slide Frames | Slide Frames |
| Non-author Editing | No | No | No | Yes |
| External Toolchain | None | TeX engine, or none with Typst | None | None |
PDF no longer requires a TeX installation. Quarto bundles Typst, which renders PDF directly (format: typst). LaTeX remains the choice for journal templates and heavy mathematics.
File Size
Single-file HTML embeds every image, font and script into the document. Per the Pandoc User’s Manual, images are base64-encoded, which adds about a third to their size. Interactive exhibits add their JavaScript libraries and the data behind them on top of that.
The examples above measure the cost directly:
| Document | Interactive | Static | Ratio |
|---|---|---|---|
Report (html vs pdf) |
14 MB | 197 kB | 70:1 |
Slides (revealjs vs pptx) |
10 MB | 154 kB | 66:1 |
Most of that weight is shared code, not content. On a website the cost mostly disappears: this page loads plotly once from the site’s own libraries, and the browser caches it for every page after.
When PDF Wins
A static format is still the right choice when the page itself matters:
- Papers. Journals and committees want PDF, and a fixed page number is something a reader can cite.
- Archives. A PDF opens the same way in twenty years. An HTML file depends on a browser running its scripts the same way.
- Print and offline reading. A fixed page prints as written.
- Size. At 197 kB, the PDF report is small enough to attach to any email.
The two can divide a project between them. The upcoming college football rankings project does: a dashboard for exploring this week’s rankings, and a paper for the method behind them.
Conclusion
Start in HTML. It keeps interactive figures, complete tables and folded code, and a browser can print it to a static page when one is needed. The conversion does not run the other way: a PDF cannot regain the interactivity it never had. Choose a static format when the page itself is the point.